In 2023, more than 2,400,000 people in the U.S. were displaced from their homes due to natural disasters. Many disaster survivors are eligible for assistance from the federal government, but those services are extremely difficult to navigate due to what’s known as “administrative burden.”
Administrative burden in government is widespread, and the Office of Management and Budget hired my team of UX designers, researchers, and CX specialists to create a way for federal agencies to measure the burden they impose on citizens who interact with their services.
After 4 months, my team delivered a prototype tool for federal agencies to calculate the administrative burden in their programs, which could also be used to help them create more customer-centric services from the outset.
Getting going
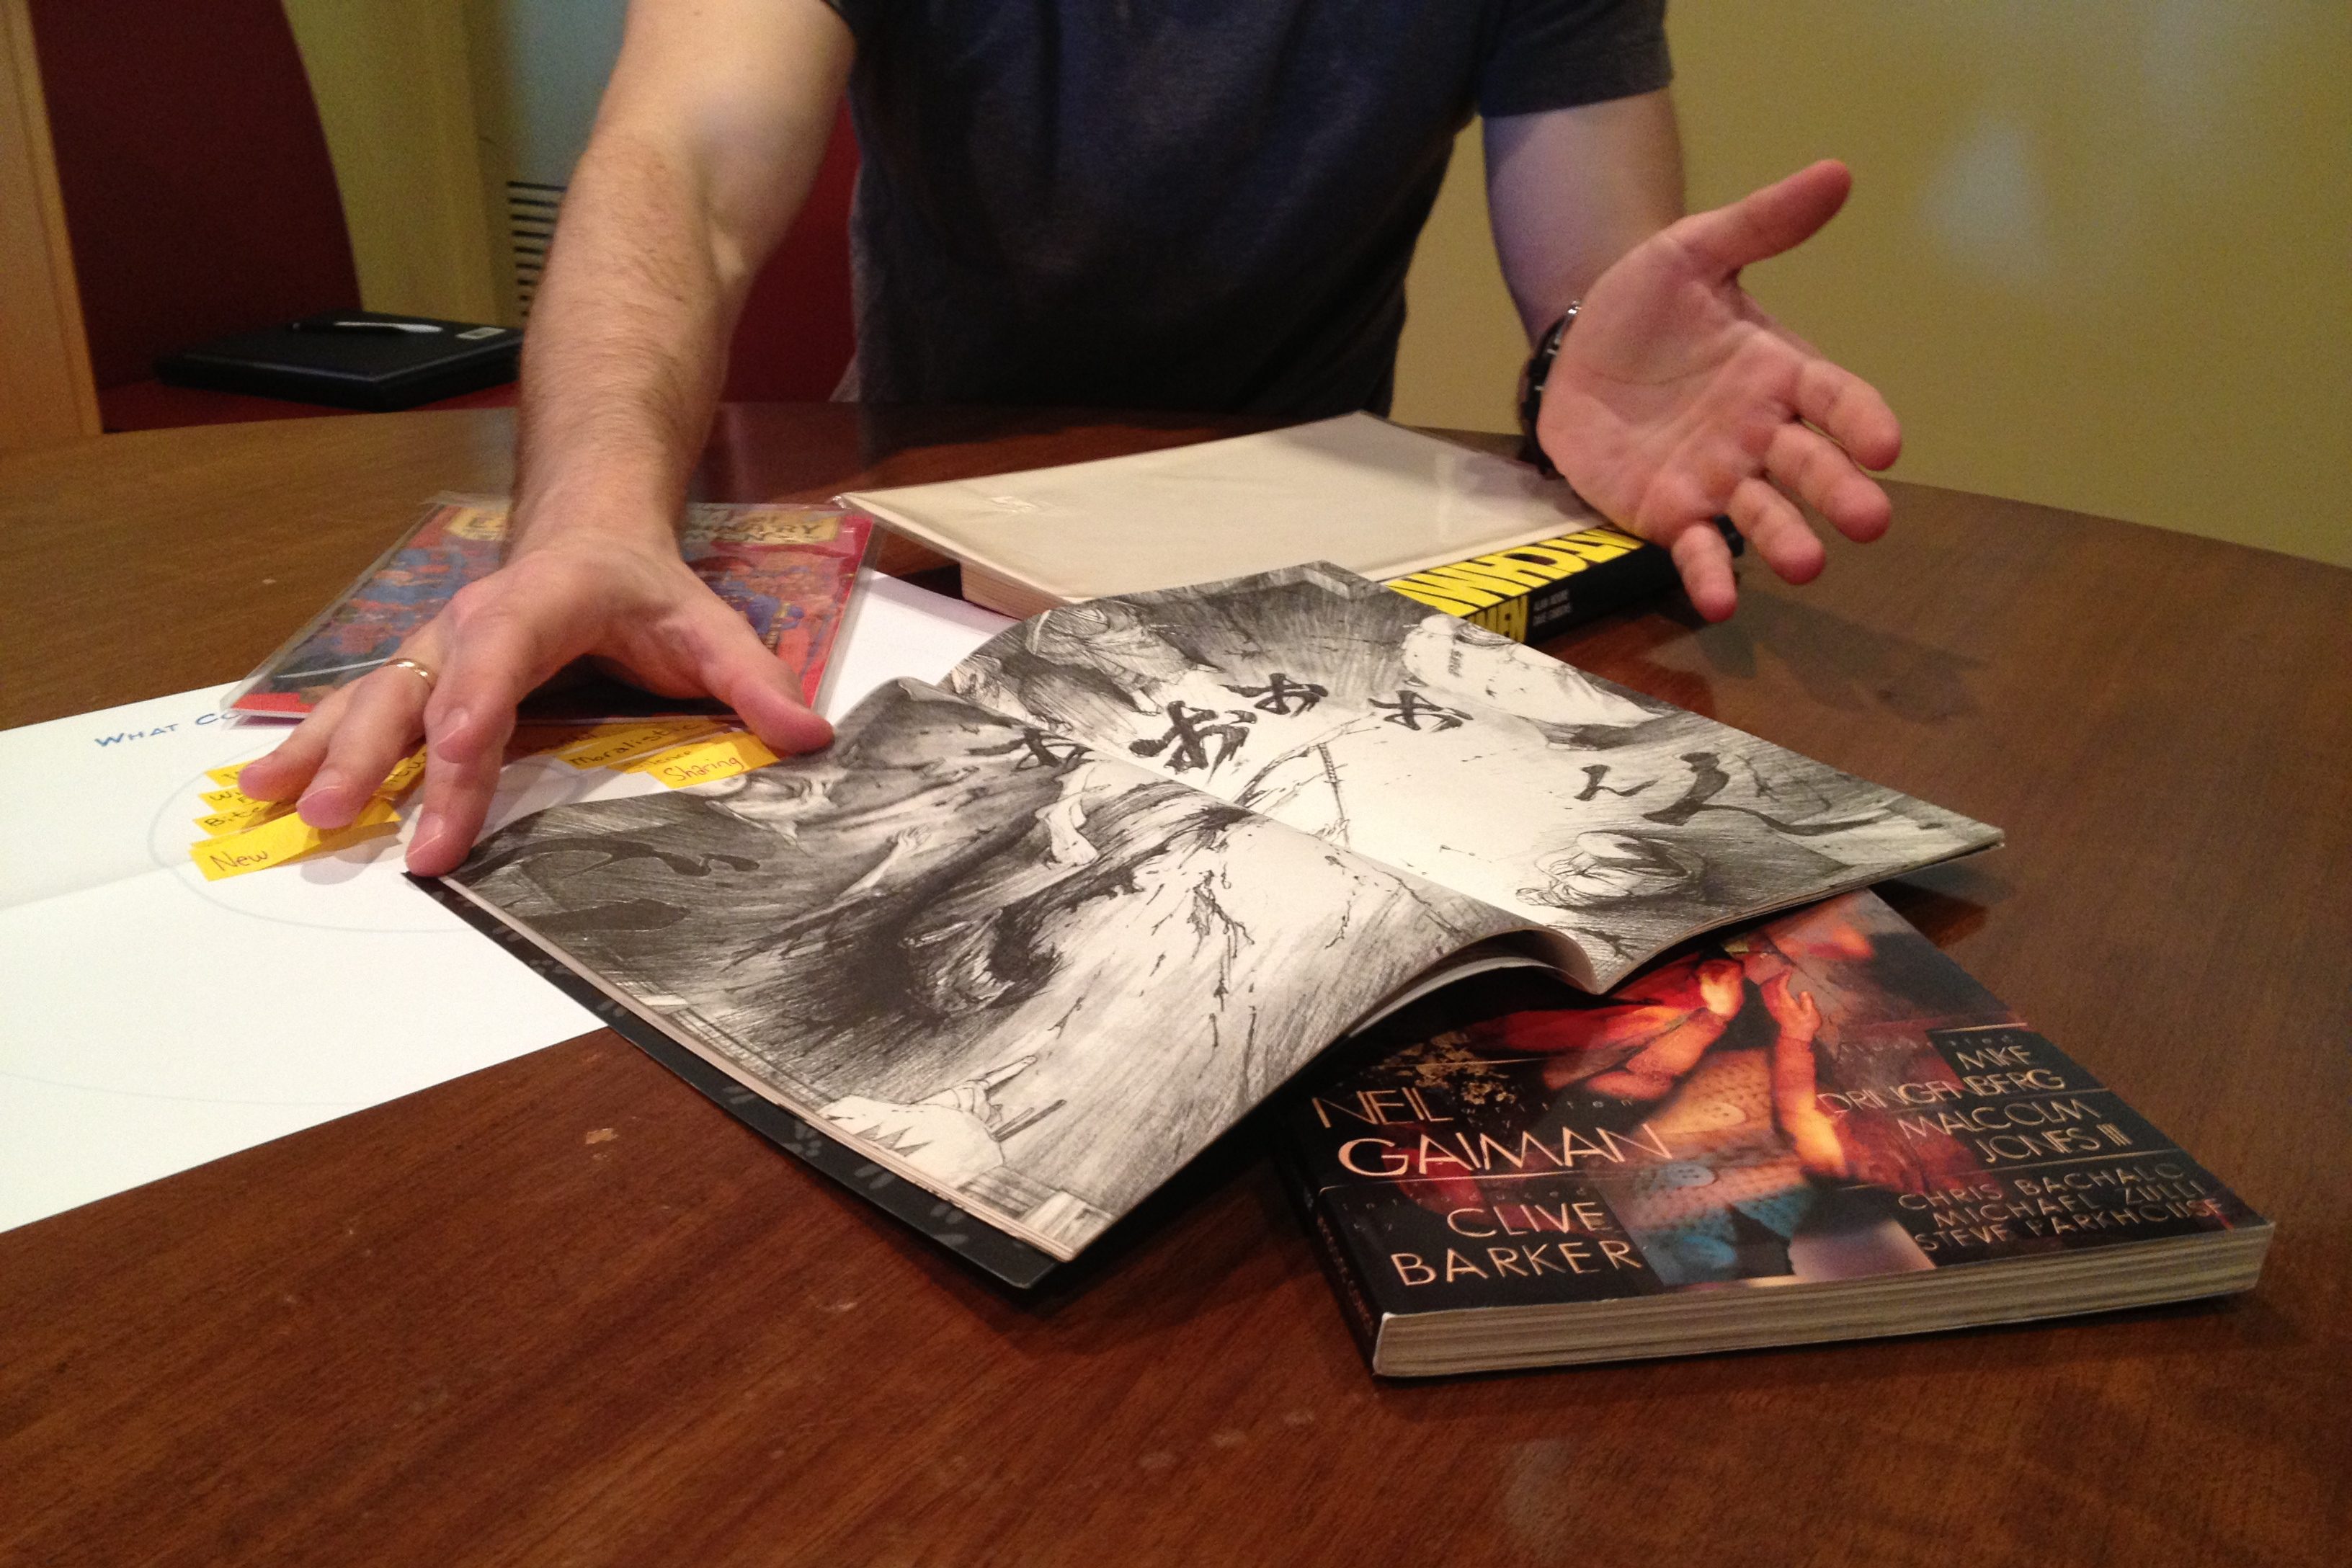
We began by reviewing primary research conducted in an earlier discovery phase, which revealed how many disaster survivors re-experience trauma when navigating complex government bureaucracy. We also learned about other governments’ efforts to address administrative burden, including those in Scotland, Canada, and New South Wales, Australia.
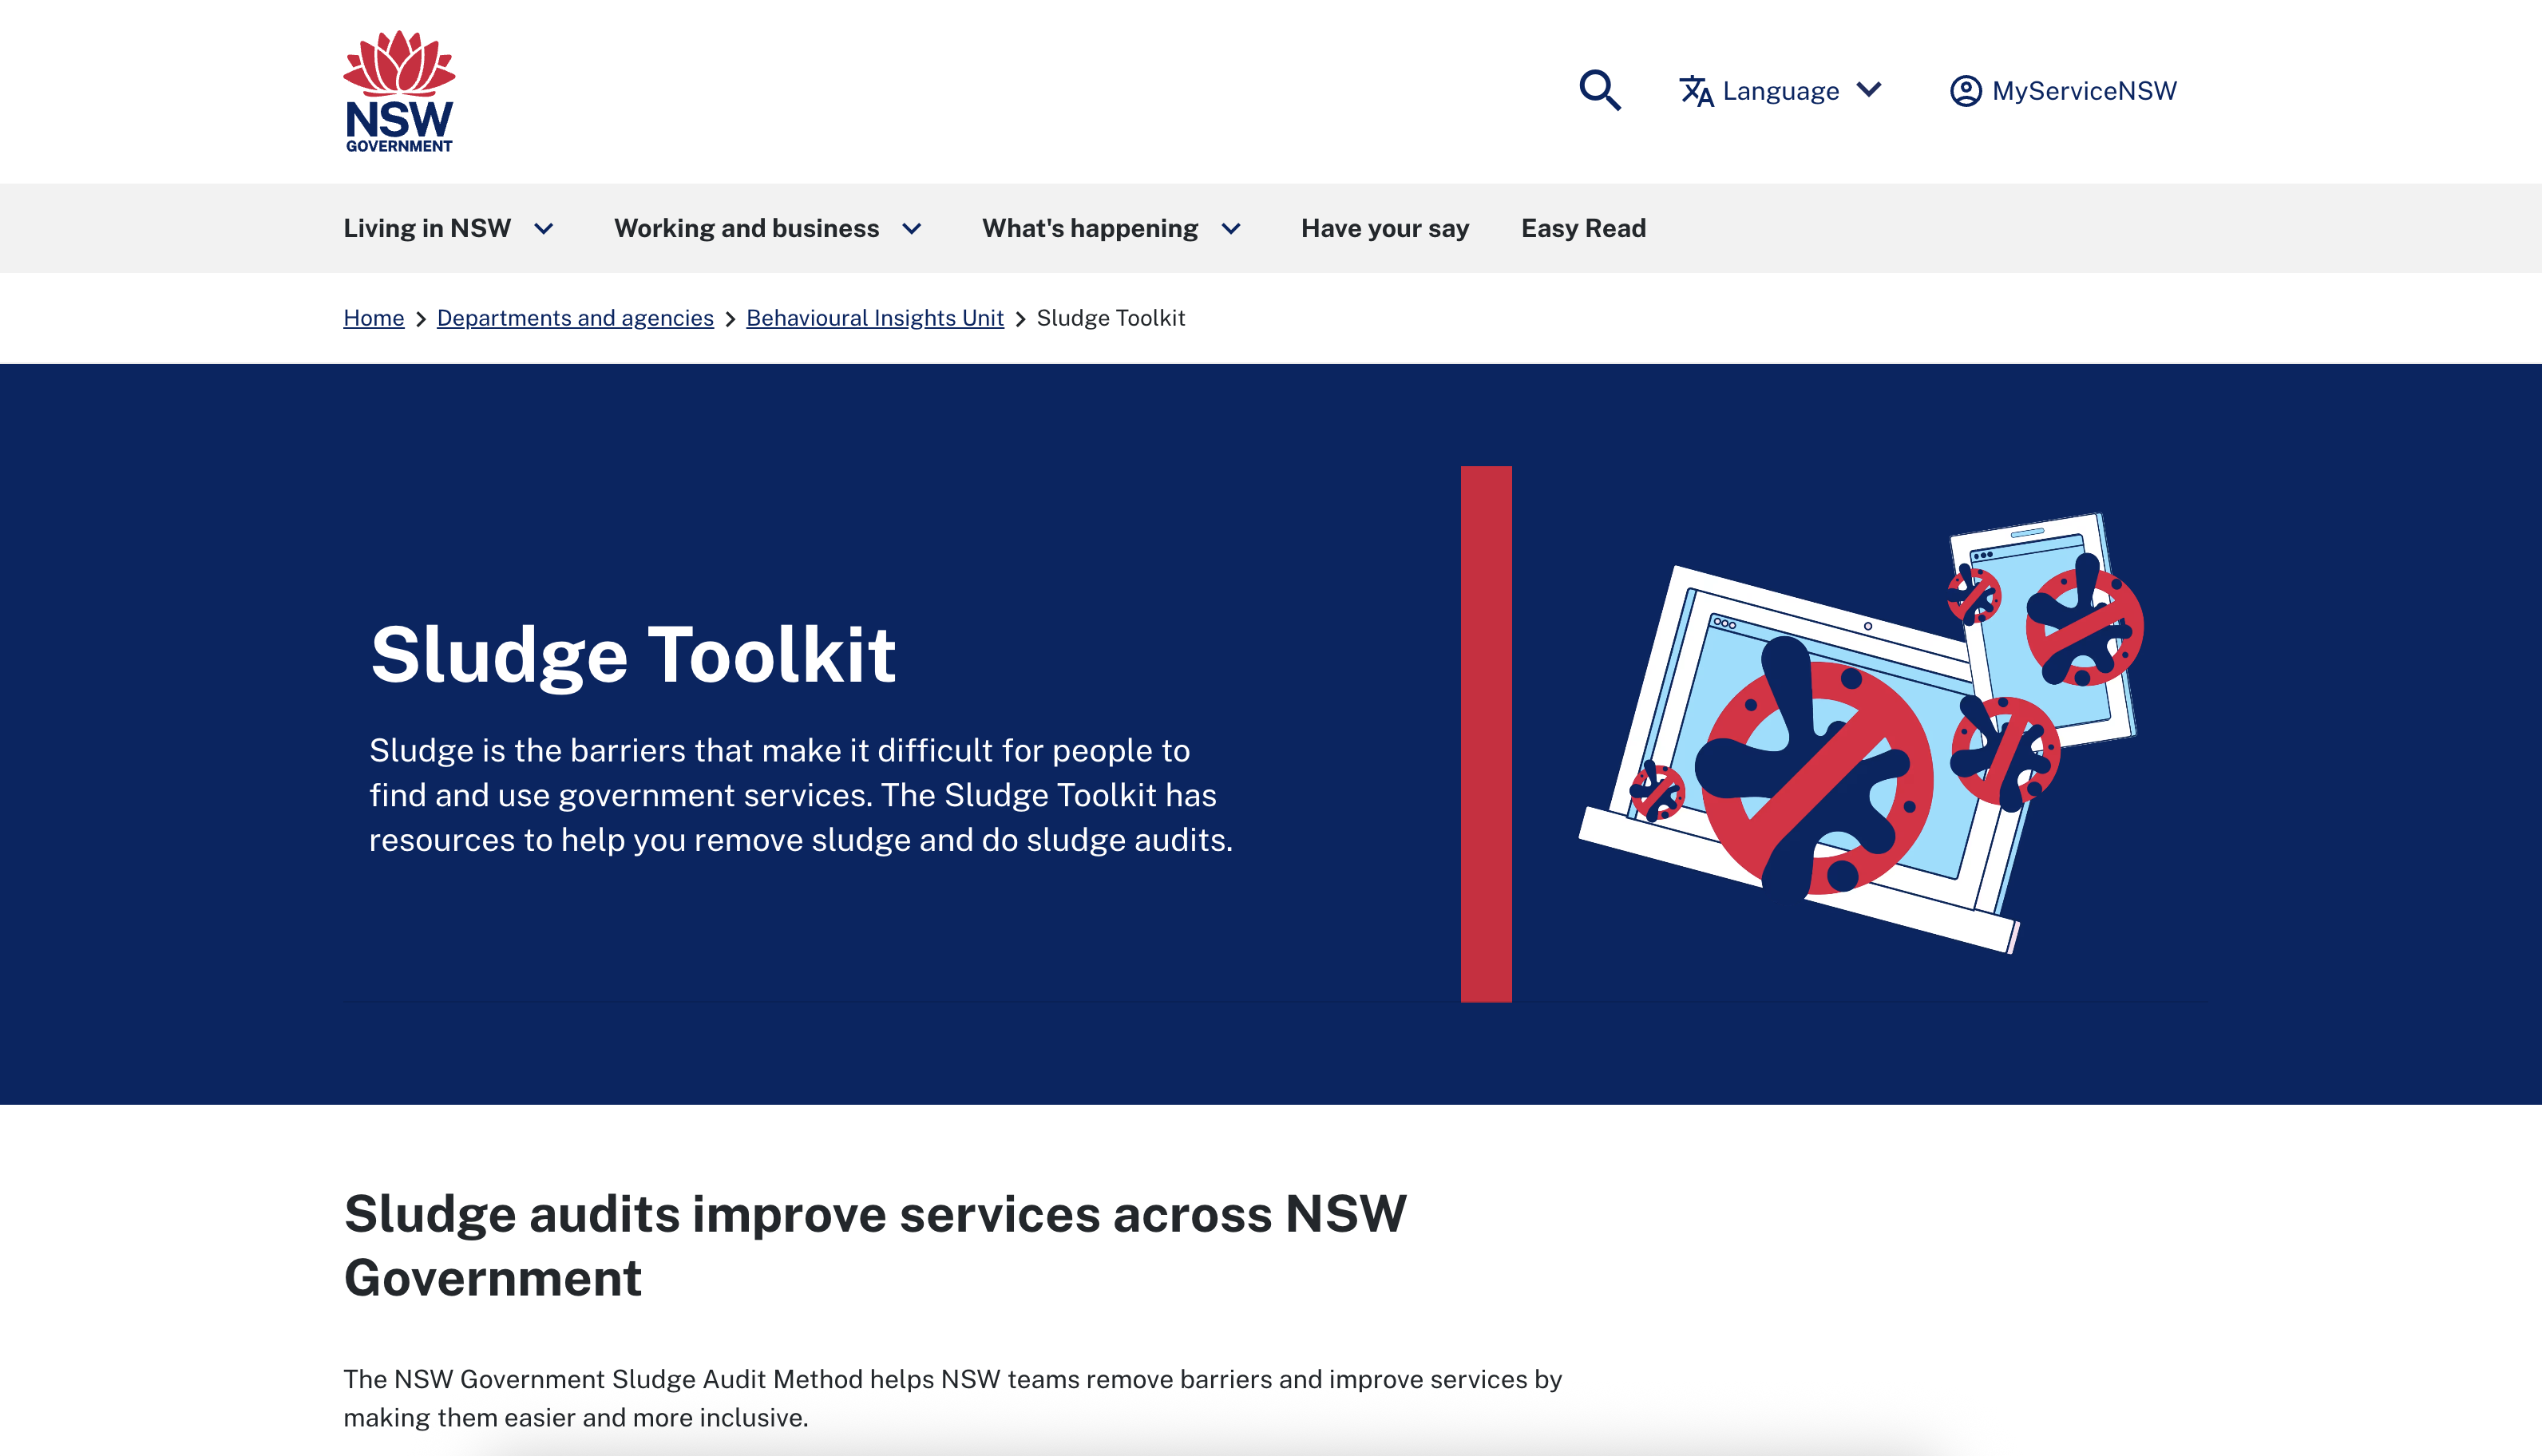
The NSW team invited my colleagues to talk about their work (on calls that started at 8pm East coast time in the US, which was the beginning of their workday the next day in Australia!). They showed us extensive research they had conducted with users and demoed the website they built, which became a major source of inspiration for our own work.
We also looked at academic research on administrative burden. Of particular interest was work out of Georgetown University by Pamela Herd and Donald Moynihan whom we met with and which described three categories of administrative burden:
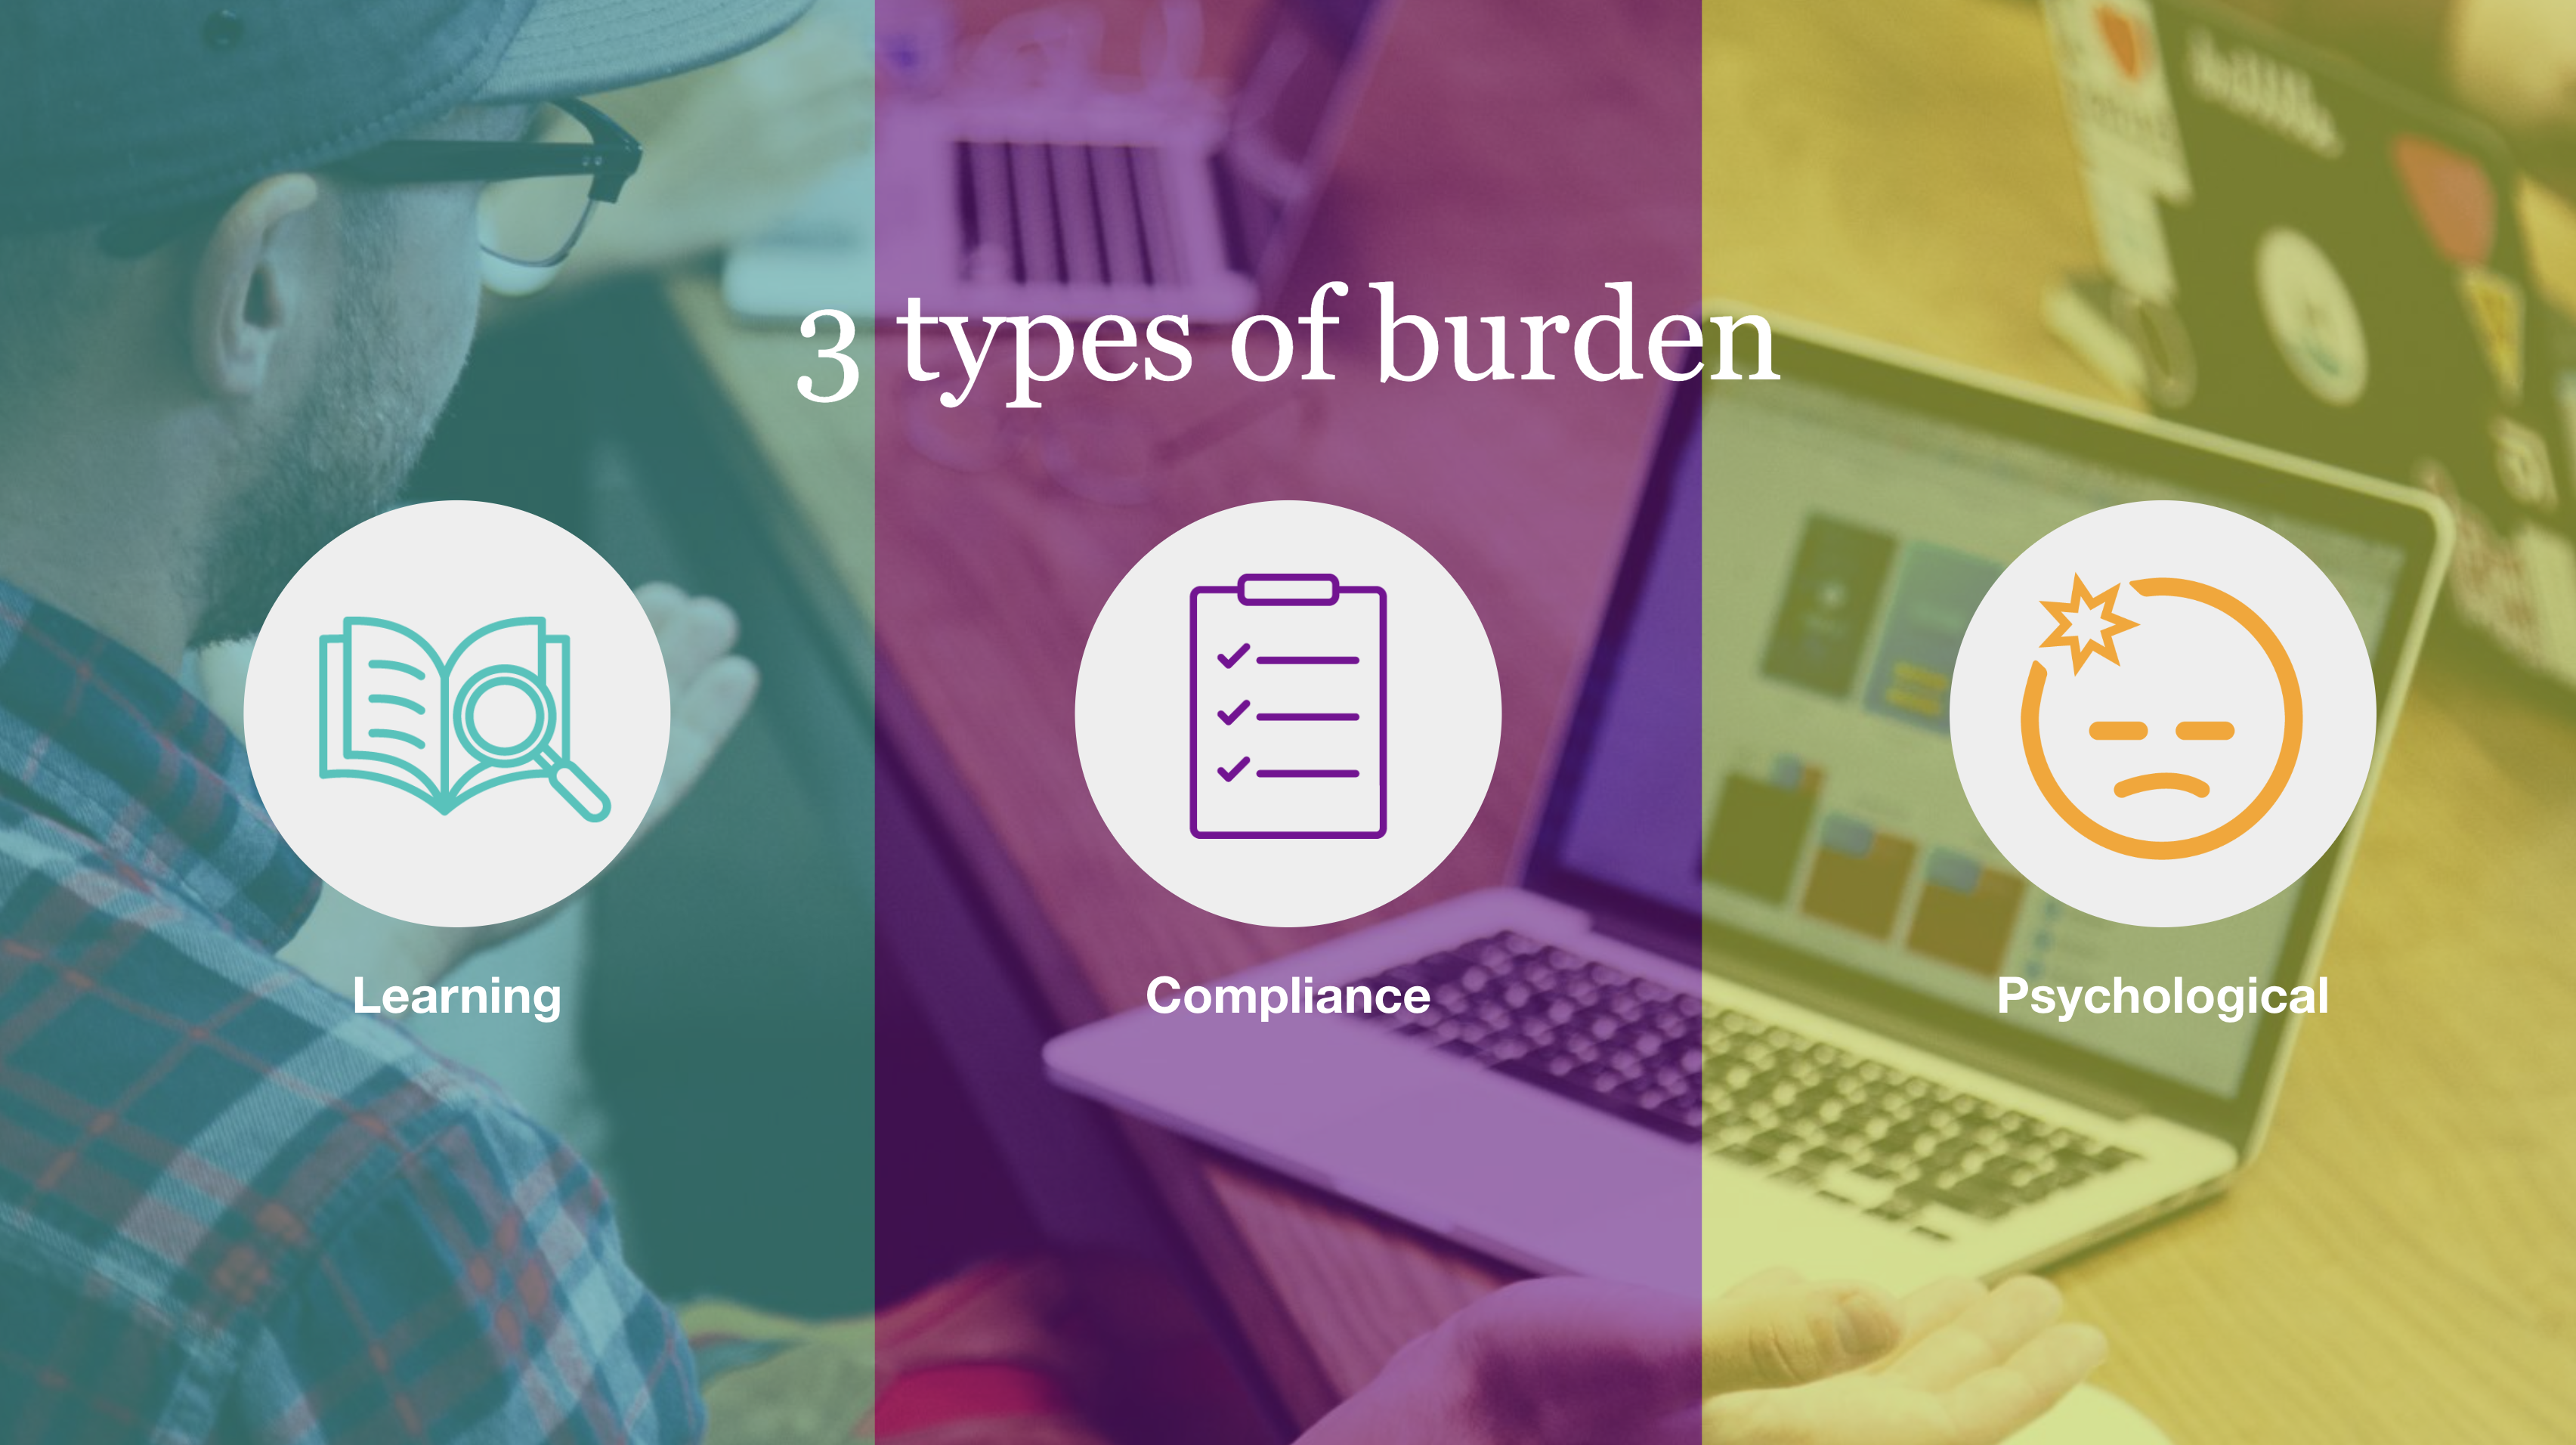
Learning: the time and effort expended to learn about the program or service, determine your eligibility and how to gain access.
Compliance: providing information and documentation, and any associated costs required to access services.
Psychological: the stigma associated with applying to and participating in a program and the loss of autonomy that comes from intrusive administrative supervision.
My team mapped participant’s mentions of burden from phase 1 research to Herd and Moynihan’s framework, resulting in a journey map which illustrated the relationship between the three burden types when disaster survivors experience them.
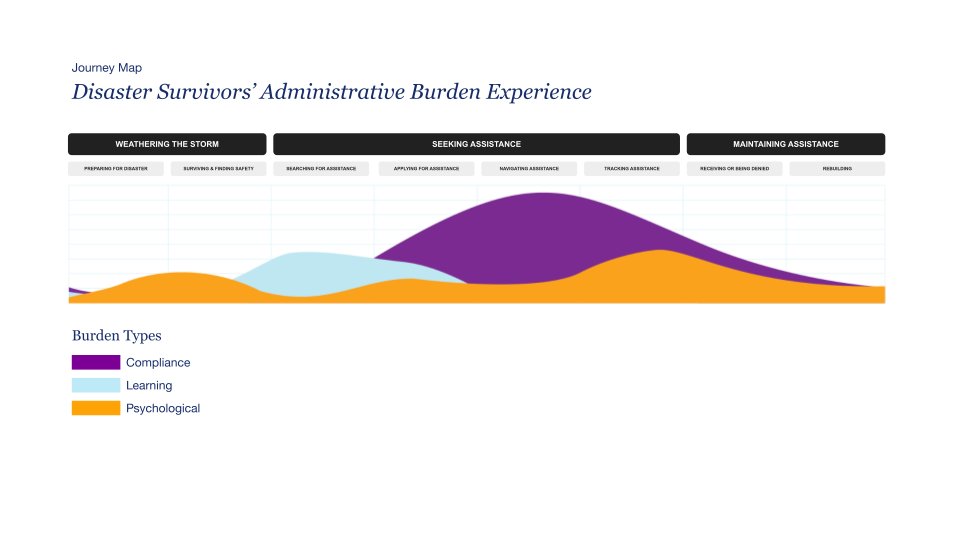
Simplified journey map of disaster survivors’ experience. (Full version here, requires password)
From data to design
We used this burden experience model to begin building our own means for assessing how agency programs create burden. We used existing customer survey data to learn what metrics agencies currently use to assess customer satisfaction. Next we interviewed thirteen people who had experienced recent disasters to validate our emerging framework for burden assessment.
My role on the team was primarily to design the prototype of a tool for measuring burden. I contributed to analysis and synthesis of data collected during participant interviews and of customer feedback data from our federal agency partners. I also collaborated on crafting the overall process that agencies would use to conduct administrative burden assessments.
Our research team was aware that asking disaster survivors to recount their experiences could potentially re-traumatize them. We prepared to mitigate that risk as much as possible by conducting a positionality exercise, using the Wheel of Power and Privilege to identify the social identities our research team was bringing to the research.

We also used Alba Villamil’s “Ethical Researcher’s Checklist” to evaluate the risks and benefits of conducting research that could potentially re-traumatize participants. And we folded all of this into how we planned and conducted our interviews with disaster survivors.
The final prototype guided users (federal employees who design and administer programs) through a step-by-step process to identify the scope of service to evaluate. It also included an equity assessment to evaluate accessibility, autonomy, and inclusivity. The prototype, built in Excel, summarized burden assessment results, which could be compared year to year.

Link to prototype (requires password)
Outcomes
Our work resulted in OMB asking us to return for a Phase 3 to further develop and test the prototype, which was deployed with 6 federal agencies. Our deliverables included the working prototype of a burden assessment tool, Figma mockups for future development, a comprehensive research report, and process documentation. The work is now being tracked as part of the President’s Management Agenda at Performance.gov.
Importantly, our work revealed itself as more than just a tool for retrospectively measuring burden. The tool and process we created could also be employed prospectively as a way for agencies to avoid introducing burdensome processes in the first place. By using the heuristics and service characteristics we outlined, federal agencies could design their services from the outset for both empathy and impact.
I used AI to help build the burden assessment tool, because the prototype was built in Excel, and my knowledge of advanced formulas was limited. I turned to ChatGPT for help, and found that by providing exact cell locations, I could get precise formulas to plug into Excel. Working with ChatGPT saved me hours of time and ultimately helped me think more strategically about data visualization, simplifying my workflow and exemplifying the practical value of AI for prototyping.
I subsequently presented this work at two conferences in 2024, first at Design for Dignity in Boston, MA, then at Impact First Digital Development Summit in Lisbon, Portugal.
Shoutouts to my magnificent team who worked with me on this project: Kamila Vasquez, Kelsey Jones, Carolyn Foley, and Megan Moser.
Link to see project details (requires password).
Project Statistics
Role: Service Designer
Dates: March – July 2023
Client: the Office of Management and Budget (OMB, a U.S. Federal Government Agency)
Skills and methods: Group facilitation · Visual communication · Process design · Prototyping · Client relations · Team leadership · Constructive feedback · Co-creation · Service Blueprints · Design Research · Trauma-informed research · Quantitative data analysis · Qualitative data analysis
Top image by Mick Haupt on Unsplash, middle image by Headway on Unsplash